By David Miguel on Feb 1, 2026
Quick links
Key takeaways
- With Tableau and Power BI, transform complex data into intuitive, interactive dashboards that enable you to monitor performance and accelerate data-driven decision making. Begin by connecting your key data sources and crafting essential dashboards for your key metrics.
- You can trust Google Analytics to figure out how folks discover your site or app and engage with it, then connect it to tools such as Google Data Studio for more beautiful visual reports. Start by configuring goals, events, and key segments so you are able to quantify the effect of your marketing and content efforts.
- Dive into big and complex data with tools like Qlik Sense, SAS Analytics, and Apache Spark when you require deeper, more advanced analytics. Pick these when you are dealing with big data, need predictive modeling, or have stringent security and compliance needs.
- You can use more modern cloud-native platforms like Looker and Domo which provide the ability to centralize data from multiple systems and standardize metrics across your organization. Focus on creating one source of truth so each team operates on aligned and reliable information.
- Enhance collaboration by sharing dashboards, reports, and real-time insights across teams with Power BI, Tableau, Looker, and Domo. Empower non-technical users to engage in self-service analytics so insights disseminate outside of data guru circles.
- Instead, you can map out your data tool stack by associating each tool to a definite business need, such as web analytics, executive reporting, big data processing, and so on. Start small with a tool or two important to your business and then scale as your data maturity and needs increase.
Data analytics tools are software that assist you in organizing, validating, and processing raw data so you can identify patterns and make informed decisions. You use them to monitor user activity, track purchases, or monitor real-time metrics. Ranging from easy dashboards to robust platforms that integrate numerous data sources, these tools accommodate both small teams and big enterprises.
1. Tableau

Summary: A data visualization and BI platform for building interactive dashboards and exploring data quickly with a drag-and-drop workflow.
Best for
- Teams needing executive-ready dashboards and storytelling visuals
- Analysts who want fast exploration without heavy engineering
What it does
- Connect to databases, warehouses, spreadsheets, and cloud sources
- Build interactive dashboards with filters, drilldowns, and parameters
- Add trend lines, forecasting, clustering, and calculations
- Publish and share dashboards for internal teams or external audiences
Strengths
- Best-in-class visual exploration and dashboard polish
- Strong for ad-hoc analysis and answering questions fast
- Wide ecosystem and community support
Limitations
- Licensing can be expensive at scale
- Governance depends on good data modelling and publishing discipline
Pricing snapshot
- Free plan: Tableau Public (public sharing; limited use cases)
- Paid plans: Creator/Explorer/Viewer licensing tiers (varies)
Use case: Best when you need stakeholder-friendly dashboards that help people explore the ‘why’ behind performance, not just read static reports.
Tableau’s specialty is quick, clean insights into your data that remain crisp as your charts become more complicated.
Its drag-and-drop interface maintains a minimal learning curve while still offering plenty of depth for power users. You can drag in fields, lay them down on rows, columns, or ‘Marks,’ and see the view change live. Need a quick hit like ‘Average order size by channel’ or ‘Conversion rate by campaign’? Just drop in the right fields and get the answer in seconds. Tableau supports drag and drop statistics, making it an effective data analysis tool as you can add trend lines, forecasts, and clusters without coding. Novices can explore simple metrics, while advanced data analysts still enjoy a nimble front end for complex models and custom views.
Its drag-and-drop interface maintains a minimal learning curve and still provides plenty of depth for power users. You drag in fields, lay them down on rows, columns, or ‘Marks,’ and see the view change live. Need a quick hit like ‘Average order size by channel’ or ‘Conversion rate by campaign’? Just drop in the right fields and get the answer in seconds. Tableau supports drag and drop statistics, so you can add trend lines, forecasts, and clusters without coding. Novices can poke at simple metrics, while the advanced analyst still gets a nimble front end to complex models and custom views.
On the data side, you can connect Tableau to various data sources, including big data warehouses and databases, and run real-time or near real-time queries. Features such as smart table and join recommendations suggest how to blend tables effectively, enhancing your data analysis process. Tableau Prep assists in pre-visualization data cleaning and shaping, a critical step since low-quality data can lead to inaccurate insights. With Tableau Public, you can share dashboards with a wide audience, support team-wide exploration, and push advanced analytics solutions outside of a tiny expert cohort.
That spread is a significant part of how Tableau aids in democratizing analytics across your organization. As businesses increasingly rely on data analysis tools, Tableau stands out as a popular tool for delivering engaging data visualizations and fostering collaboration among data teams.
2. Power BI

Summary: Microsoft’s BI platform for building reports and dashboards-especially strong when your data and workflows already live in Microsoft 365.
Best for
- Teams using Excel, Teams, SharePoint, SQL Server, and Azure
- Businesses wanting a cost-effective BI standard across departments
What it does
- Model data with relationships and measures (DAX)
- Clean and transform data with Power Query
- Publish reports to the Power BI Service and share dashboards
- Control access with row-level security and workspace permissions
Strengths
- Deep integration with Microsoft ecosystem
- Strong value for money and broad connector coverage
- Solid governance options for enterprise sharing
Limitations
- DAX and modelling have a learning curve for non-analysts
- Complex models can require performance tuning and best practices
Pricing snapshot
- Free plan: Limited (sharing typically requires Pro/Premium)
- Paid plans: Per-user licensing and Premium capacity options (varies)
Use case: Best when you want one reporting layer for the business and you already run on Microsoft tools—so sharing and adoption are frictionless.
Power BI is a powerful analytics platform for transforming raw data into transparent, collaborative insights. It’s particularly advantageous if you already work with Microsoft tools daily. With minimal friction, you can pull in data from various sources such as Microsoft Excel, SharePoint, SQL Server, and Teams. For instance, you could extract monthly sales figures from an Excel sheet in OneDrive, enhance it with customer data from SQL Server, and then publish a unified report to Microsoft Teams so your entire team sees consistent numbers. This connection to the broader Microsoft ecosystem helps maintain a single source of truth rather than pursuing disparate documents.
To construct reports, you deal with two principal parts. Power BI Desktop lives on your machine and enables you to connect to more than 100 data sources, shape data and design pages with charts, tables and KPIs. The Power BI service runs in the cloud, allowing you to publish, share and refresh those reports. Here’s what a typical configuration looks like. You develop your model and test it in Desktop, publish to the service, then pin important visuals into dashboards that leaders follow. With more than 30 built‑in visuals and hundreds of custom ones, you can jump from a simple bar chart to a complex heat map with no additional coding.
When it comes to cleaning and preparing data, you utilize Power Query Editor, an effective data analysis tool that allows you to eliminate blank rows, separate messy text fields, join queries, and convert data types. Once the data is cleaned, you move into modeling. Power BI employs DAX for measures and calculated columns, establishing relationships between tables so the model scales as your data grows. For example, you could create a DAX measure for year-to-date revenue, add a relationship to a calendar table, and use a performance analyzer to identify slow visuals and optimize them. Features such as composite models and external tools provide additional layers when your models become large or intricate.
For perspective, the integrated AI capabilities assist you in exploring further. Run key influencers visuals to understand what’s driving churn, or use decomposition trees to break metrics down by region, product, or channel. Grouping and binning assist you in managing big sets by clustering values into obvious ranges, like age bands or income brackets. When you share, dashboards refresh in real-time with streaming data so teams can monitor live metrics from sensors, web traffic, or sales systems and respond quickly. Access operates seamlessly on both web browsers and mobile applications, complete with row-level security ensuring every viewer stays focused on their designated data segment.
3. Google Analytics

Summary: An event-based web and app analytics tool for understanding acquisition, behaviour, and conversions—useful for marketing optimization and measurement.
Best for
- Marketers improving landing pages, funnels, and channel ROI
- Teams that need conversion tracking and audience insights
What it does
- Track events and conversion actions across web and app
- Analyze acquisition channels, landing pages, and user journeys
- Create audiences for remarketing and segmentation
- Export or visualize data in Looker Studio and other reporting tools
Strengths
- Strong measurement foundation and broad industry adoption
- Good for diagnosing drop-offs and content performance
- Integrates well with Google Ads and Looker Studio reporting
Limitations
- Needs solid implementation (events, conversions, tagging) to be reliable
- Interpretation requires context-avoid treating it as ‘truth’ without validation
Pricing snapshot
- Free plan: Yes
- Paid plans: GA 360 enterprise tier (varies)
Use case: Best when you want clear visibility into how users find your site, what they do, and which experiences drive sign-ups or revenue.
Google Analytics provides you with transparent visibility into how users behave on your site and app so you can make intelligent decisions with actual data.
You receive complete visibility into user behavior, traffic sources, and what results in a sign-up, purchase, or other important action. You see where users originate, their entry pages, the duration of their visits, and their exit points. For instance, you may observe that paid search users bounce quickly on mobile, while email users hang around and view many pages. That sort of granularity lets you repair slow pages, optimize ad spend, or tune copy based on actual user behavior. With the newer GA4, you track events and conversions across web and app, so a user who starts on a phone app and pays on desktop can still appear as one joined journey.
To make all that easier to digest, you can construct your own dashboards and leverage real-time reports. Select the charts and numbers that matter most, like users by country, sessions by device, and top landing pages. For instance, you can configure a glance view of live users on site, active pages, and active events, which is useful during a campaign launch or sale. Real-time data shows if a new ad or email blast is generating traffic now, rather than waiting hours and guessing if it worked.
For more detailed reporting and tidier charts, you can connect GA with Google Looker Studio. Data Studio extracts information from Analytics and then allows you to construct multi-page reports incorporating filters, scorecards, and blended data. For example, you may combine GA4 data with ad platform data in a single report, so you see ad spend, sessions, and revenue by channel in a single view. Many teams use these reports to share live reports with managers or clients, who see updates without export. Third-party tools can leverage the Google Analytics API to construct custom reporting systems or internal dashboards if you require more tailored setups.
Audience segments and goals give you razor-sharp insight into what works. Group users by source, device, location or behavior, then drill down and examine each group in detail. You can compare those who view at least three product pages with those who see only one and see which converts better. Goals or conversion events track things like form fills, purchases, or video plays, so you can measure how well each campaign drives those actions. This helps you trim weak channels, amplify strong ones, and optimize landing pages with actual evidence.
Google Analytics is immense in reach. It’s used by about 73.7% of the 10k most popular sites, and approximately 13.5 million sites run GA4 as of 2023. GA4 now supersedes Universal Analytics, which ceased recording new data in July 2023. GA4 introduces enhanced data privacy by default, anonymizing all IP addresses, while some countries still express concerns related to data transfer and third-party access. It utilizes an asynchronous tracking code that loads in a manner that can capture even very short visits more reliably. If you want to build skills, Google’s Skillshop provides four GA4 courses and a certification, which guides you or your team through the tool in a structured educational format.
4. Qlik Sense

Summary: A self-service analytics platform known for its associative engine-helpful for exploring data relationships without fixed drill paths.
Best for
- Teams that need flexible exploration across complex datasets
- Organizations combining many sources into a single analysis layer
What it does
- Blend data sources into a single model for interactive dashboards
- Explore associations across fields to uncover patterns and gaps
- Build self-service dashboards for business users
- Use built-in data prep tools to profile and transform datasets
Strengths
- Associative analysis helps uncover ‘what’s missing’ as well as what’s present
- Strong for multi-source exploration and discovery
- Good self-service capabilities when models are set up well
Limitations
- Best results require thoughtful data modelling and governance
- Can be harder to standardize metrics without strong data ownership
Pricing snapshot
- Free plan: Trial/limited options vary
- Paid plans: Qlik Cloud/enterprise licensing (varies)
Use case: Best when your questions change often and you want users to explore data freely—without being locked into predefined drilldowns.
Qlik Sense offers you flexible, self-service analytics that scale. You use it to transition from reports to live, clickable views of your data that support real decisions.
When you’re looking to drill into layered data, you depend heavily on Qlik Sense’s associative data engine. When you click on any field, Qlik highlights associated values in one color and non-associated values in another with no fixed drill paths. For instance, you’re a retailer and choose a single region and a product line. You don’t merely see sales for that match. You view all the customers in that area who didn’t buy that product or bought others. That sort of “green and gray” perspective enables you to identify cross-sell holes or peculiar tendencies that a basic filter would conceal.
For the workaday stuff, you create interactive dashboards that your team can access without involving IT. Qlik Sense allows you to configure charts, maps, and KPI tiles by dragging fields into views, then switching chart types with a click. A sales manager can open a dashboard, tap on a key account and watch margin, orders, and open tickets update in real time. For example, a finance lead can pivot from monthly to weekly numbers on the same page. Since Qlik Sense is mobile by design, those very same dashboards adapt to a tablet or phone, with filters and drill downs ready for touch.
To get that complete picture, you typically aggregate information from numerous sources. Qlik Sense integrates with hundreds of sources, from cloud tools like Salesforce and Google Analytics to on-premise SQL databases and even simple CSV or Excel files. You might load marketing spend from a cloud app, cost data from an on-premises ERP, and website events from log files. All of that comes together in one model, so you can compare cost, traffic, and revenue in one dashboard, not six different tools. If you’re more into cloud, Qlik Cloud Analytics brings you that very same engine in a SaaS configuration, which can be useful if your teams are located across different countries.
Qlik Sense provides built-in data preparation and wrangling to clean and shape data. You can profile data, join tables, group messy values, and build reusable transformation steps. For instance, you might normalize country names, extract a tidy “Order_Date” from grungy timestamps, and then apply that pipeline to every new data load. That saves manual labor and helps you trust the numbers before people begin to use them. Behind the scenes, the Qlik Sense Proxy manages user access and directs you to the appropriate services, so you log in a single time and interact with apps, visualizations, and extensions without touching the platform’s guts.
5. SAS Analytics

Summary: An enterprise analytics suite built for advanced statistics, forecasting, and machine learning-commonly used in regulated, high-stakes environments.
Best for
- Organizations needing robust modelling, governance, and auditability
- Teams doing forecasting, risk, fraud, or predictive analytics at scale
What it does
- Run advanced statistical methods and predictive models
- Build repeatable data prep and transformation flows
- Create forecasts and scoring models for operational decisions
- Apply enterprise security, access controls, and compliance practices
Strengths
- Very strong depth for statistics and predictive analytics
- Built for scale, governance, and repeatability
- Trusted in regulated industries and complex analytics programs
Limitations
- Steeper learning curve; often requires specialized skills
- Licensing can be expensive for smaller teams
Pricing snapshot
- Free plan: No (typically)
- Paid plans: Enterprise licensing/pricing varies by deployment
Use case: Best when analytics outcomes carry real risk or cost—where governance, accuracy, and repeatable models matter more than quick dashboards.
SAS provides you with heavy-duty statistics and machine learning in the same location. You receive a comprehensive suite for data analysis, preparation, and business intelligence, designed for tasks extending beyond simple dashboards. In countless teams, SAS sits at the hub of reports, models, and forecasts that shift real money and real risk.
When it comes to advanced data modeling, you can leverage a broad array of techniques in SAS Analytics. You work with regression, decision trees, clustering, and dozens of other techniques without having to leap between tools. For instance, you may do a logistic regression to score loan default risk in a bank, then test it against a decision tree model on the same data. In retail, you cluster customers by buying habits to construct segment-based campaigns. It is designed for large data, so analyzing models on tens of millions of rows remains feasible, not an overnight task, especially with the right data analytics tools.
On the data prep side, SAS helps you reduce manual effort. Automate tasks like scrubbing messy columns, missing values, table joins, and reshaping. That comes in very handy for big data projects where you’re dealing with logs, transaction data, or sensor feeds. Imagine a care team that extracts patient records from multiple systems. SAS analytics flows can normalize codes, remove duplicates, and identify outliers on a schedule. You define the logic once and let the workflows run, liberating you from endless spreadsheet patching.
For predictive analytics and forecasting, SAS is one of the classics. Build models that score churn risk, product demand, fraud likelihood, or equipment failure. In a supply chain environment, for instance, you may employ time series forecasting to map out stock levels for thousands of items at multiple locations. You then feed that forecast back through dashboards so planners see clear signals, not just raw charts. It’s straightforward. You end up with repeatable, documented models that support your calls with data, making it an effective data analysis tool.
A lot of teams choose SAS for its enterprise-grade security and compliance history. You can manage dataset access, record user activity, and operate in defined roles, which is critical in finance or healthcare. It supports regulated setups where data privacy laws and audit rules come into play. Banks can lock credit data by region and role. Hospitals can keep patient data masked but still available for analysis.
There are a couple of trade-offs. SAS can be confusing and difficult to learn, particularly if you’re unfamiliar with statistics or programming. It typically requires formal training and a while before you feel speedy in it. Cost is an issue. Licensing for big deployments or advanced features can be steep, so it fits teams that actually use it deeply. The bright side is the huge user community and powerful online resources. You discover guides, forums, and official docs that assist you in correcting mistakes, choosing techniques, and implementing best practices, which are essential for mastering data analysis skills.
6. Looker

Summary: A BI platform built around a governed semantic layer (LookML) so teams share consistent metric definitions on top of a central data warehouse.
Best for
- Teams with a modern warehouse (BigQuery, Snowflake, etc.) needing one source of truth
- Organizations embedding analytics into products or internal tools
What it does
- Model metrics and joins once in LookML for consistent reporting
- Create self-service dashboards and explorations on governed models
- Schedule reports and alerts, and share dashboards securely
- Embed dashboards and analytics experiences into other applications
Strengths
- Strong governance and metric consistency across teams
- Excellent fit for warehouse-first analytics
- Powerful embedding options for product and internal tooling
Limitations
- Requires data modelling effort to set up well
- Non-technical users get most value after the semantic layer is built
Pricing snapshot
- Free plan: No (typically)
- Paid plans: Tiered (Standard/Enterprise/Embed) pricing varies
Use case: Best when you want to stop metric drift—so ‘revenue’, ‘active users’, and ‘conversion rate’ mean the same thing everywhere.
Looker is unique in how it combines custom apps, powerful modeling, and elegant self-service dashboards in one platform. Here’s a fresh data analysis tool that integrates right into everyday work rather than hanging around on the sidelines as a standalone piece. Many teams use Looker to embed charts, key numbers, and lightweight data apps right inside sales portals, support systems, or internal tools. A support manager, for instance, can view real-time ticket volume and response time within the helpdesk screen, not in a different tab.
To create that, you link Looker to your primary data warehouse and sources. It fits well with BigQuery, Snowflake, and other SQL-based stores, then aggregates them into one view. At the heart of that effort is LookML, Looker’s SQL-centric modeling language. Your data teams define models that describe joins, measures, and dimensions once, then everyone else explores on top of that. You sidestep every analyst coding up their own SQL for ‘monthly revenue’ and coming up with different numbers. For instance, your finance team can segment revenue by product, region, or channel with that identical foundational logic.
Looker then provides self-service analytics on top of those models. Drag and drop to build charts, tables, and interactive dashboards that draw from dozens of sources simultaneously. A marketing lead could create a dashboard showing ad spend in one system, web traffic in another, and sales from the warehouse, all linked together. You can save these views as Looks and group them in Folders and Boards so teams stay organized and can find what matters quickly.
For day-to-day work, the platform has distinct user types that correspond to real roles. Viewer users simply view and interact with shared dashboards. Standard users sift data, construct Looks, and customize reports. Developer users develop in LookML, manage models, and configure some of the more advanced capabilities. Beyond that, you can schedule reports, send alerts when numbers cross a threshold, and share dashboards with stakeholders in real-time via links or email.
To distribute analytics across your entire organization, Looker relies on robust governance and embedded options. You maintain consistent metric definitions in LookML and apply centralized permissions so teams view the appropriate data with a common meaning. Then you can embed and create custom apps to integrate dashboards or entire analytics flows into other tools you use with customers or employees. Conversational Analytics adds a layer where users type in simple questions in natural language and get charts back, enabling less technical users to work with data on their own. Pricing ranges across Standard, Enterprise, and Embed plans, so you align features and scale with your stage and use case.
7. Domo

Summary: A cloud-native BI and data platform that centraliszes data from many systems and delivers dashboards, alerts, and self-service insights to the business.
Best for
- Teams wanting a single dashboard layer across many SaaS tools
- Businesses needing mobile-friendly dashboards and broad connector coverage
What it does
- Connect and ingest data from many cloud/on-prem sources
- Transform and schedule data pipelines (ETL) inside the platform
- Build KPI dashboards and role-based views for different teams
- Deliver alerts and mobile access for real-time monitoring
Strengths
- Strong connector ecosystem and cloud-first delivery
- Good for operational dashboards and cross-team visibility
- Mobile experience is a core part of the product
Limitations
- Can feel feature-heavy; navigation can take time to learn
- Cost can be high depending on data volume and user needs
Pricing snapshot
- Free plan: No (typically)
- Paid plans: Business/enterprise pricing varies by scale
Use case: Best when you need to unify reporting across multiple systems quickly and push dashboards out to non-technical teams in a usable way.
Domo provides you with one place to import massive volumes of data and convert it into transparent, collaboratively usable insight. You get a cloud-native platform, launched in 2010, that was designed from day one to live on the web and scale as your data grows. This powerful analytics tool is essential for teams looking to streamline their data analysis process.
To unite data, you can connect Domo to just about every system. It includes more than 1,000 pre-built connectors for cloud and on-prem sources, along with custom connections via APIs, SDKs, and webhooks. Your CRM, ERP, ads platforms, support tools, and spreadsheet files can all land in one central space. For example, you may combine sales records from your ERP with web traffic and support tickets, then visualize your entire customer funnel in a single view instead of hopping between five popular data analysis tools.
To maintain that data digestible, Domo relies on dashboards and visual perspectives. You create charts, cards, and entire pages that monitor the KPIs you care about most, like conversion rate or churn or on-time delivery. Metrics update as new data arrives, so your daily revenue or open incident dashboard stays up-to-date without a manual refresh. Most teams configure role-based pages, like a simple tile view for frontline staff and trend charts for managers, utilizing effective data analysis tools to enhance their workflow.
To prep data, Domo supports automated integration and ETL flows. You can configure rules to clean, join, and reshape data on a schedule, so you never get late or stale reports. For example, you could run an hourly job that pulls data from your payment gateway, maps messy product names to a standard list, and loads it into a clean table for your finance dashboard. Under the hood, the platform takes on very large workloads and states it queries more than 100 trillion rows of data every day, which makes a difference if your data volume scales quickly.
To take analytics outside your data team, Domo emphasizes self-service and mobile access. Business users can construct simple charts, filtered views, and drill into details without code. The mobile interface is a first-class part of the product, not an afterthought, so you can check dashboards, get alerts, and explore data on a phone during a commute or site visit. Domo supports multiple types of analytics as well, from basic descriptive perspectives to diagnostic deep dives, all the way to predictive and prescriptive, and even more advanced cognitive techniques for pattern detection. This spectrum enables small teams as well as large enterprises to adopt the same platform and mature into more advanced use cases over time. The tradeoff is that a handful of users find the interface less friendly than other tools, and you might experience some trial and error to figure out where important features live and how to get the most out of it.
8. Apache Spark

Summary: An open-source distributed computing engine for large-scale data processing, ETL, streaming, and machine learning workloads.
Best for
- Data engineering teams processing very large datasets
- Organizations needing batch + streaming pipelines at scale
What it does
- Run distributed ETL and transformations across clusters
- Process streaming data (Structured Streaming) for near real-time use cases
- Use MLlib for scalable machine learning workflows
- Integrate with data lakes and warehouses (S3/ADLS/GCS/HDFS, etc.)
Strengths
- High performance for big data workloads when tuned well
- Flexible APIs across Python, SQL, Scala, and Java
- Massive ecosystem and strong community
Limitations
- Not plug-and-play—requires distributed systems knowledge
- Performance depends on cluster sizing and optimization
Pricing snapshot
- Free plan: Open source (infrastructure costs apply)
- Paid options: Managed platforms (e.g., Databricks) vary
Use case: Best when your data volumes or processing needs outgrow standard BI tools and you need reliable, scalable pipelines to feed warehouses and dashboards.
Apache Spark provides you with fast, scalable data processing for heavy workloads, making it one of the top data analytics tools available today. You get a single engine that can handle batch processing, streams, and advanced analytics all in one place. This integration means your stack remains neater, and your data workflows stay more consistent, which is crucial for effective data analysis.
To manage really big datasets, Spark distributes your data over a cluster and executes jobs in parallel. Its key innovation is the resilient distributed dataset, or RDD, a read-only collection of data divided across multiple machines and maintained in a fault-resistant manner. If one node crashes, Spark reconstructs the lost partitions using the original data and lineage information. For you, this translates into long-running jobs such as log aggregation across terabytes of files or complex joins across large tables that can still finish without rebooting, ensuring powerful analytics capabilities.
For advanced analytics, leverage Spark’s native machine learning and streaming libraries. Spark MLlib can be utilized for classification, regression, clustering, and recommendation tasks. A typical example is training a recommendation model on billions of user-item interactions or scoring credit risk on extensive transaction histories. Additionally, Spark Structured Streaming allows you to work with real-time feeds, such as clickstream or sensor events, using code that closely resembles batch DataFrame queries. This keeps your learning curve flatter once you grasp the main API style, making Spark an effective data analysis tool.
You’re not tied to a single language, either. Spark is open source and supports Scala, Java, SQL, R, Python, and Swift, with third-party bindings for .NET CLR and Julia. Many data teams default to Python for data science notebooks and Scala for production pipelines. Spark provides three main APIs: RDDs for low-level control, DataFrames for SQL-like structured data work, and Datasets for typed operations. You can select the abstraction layer that best suits your task, from straightforward SELECT and GROUP BY queries to bespoke functions on distributed collections, enhancing your data analysis skills.
On the integration front, Spark interfaces seamlessly with Hadoop (HDFS), SQL databases, and cloud data lakes like Amazon S3, Azure Data Lake, or Google Cloud Storage. You could load raw CSV or JSON files from object storage, join them with tables from a relational database, and write back to a parquet dataset used by your business intelligence applications. Many teams use Spark as the workhorse behind complex ETL pipelines, where you scrub, enrich, and reformat data before it hits a data warehouse, ensuring that you have the right data analytics software for your needs.
Spark is great for enterprise grade data engineering. It doesn’t feel plug and play at first. You need to know distributed computing fundamentals, cluster managers, memory and executors configuration. Performance can rely on cluster tuning, including right-sizing executors, memory adjustments, and selecting storage formats that enable column pruning and compression. The upside is robust community support. Spark, released in May 2014, has grown a large user and contributor base and a broad ecosystem of libraries for processing, machine learning, and even data visualization. You’ll find plenty of examples, tutorials, and best practices for such workloads as daily aggregations, anomaly detection, or large-scale feature engineering.
9. IBM Watson

Summary: A suite of AI and analytics capabilities that can help teams analyze data, build models, and extract insights-often through guided or natural-language experiences.
Best for
- Teams exploring AI-assisted analytics and modelling in enterprise environments
- Use cases involving text/unstructured data and predictive insights
What it does
- Assist with exploratory analysis and insight discovery
- Support building and deploying predictive models (depending on product/module)
- Analyze unstructured text for themes and sentiment
- Integrate with enterprise data sources and workflows
Strengths
- Helpful for accelerating analysis and reducing manual exploration
- Strong fit in enterprise stacks and regulated contexts
- Can extend beyond dashboards into applied AI use cases
Limitations
- Watson is a broad brand-capabilities vary by product and module
- Setup and value depend on data quality and clear use cases
Pricing snapshot
- Free plan: Varies by offering/trial
- Paid plans: Enterprise pricing varies by module and scale
Use case: Best when you want AI-assisted analysis on enterprise data (including unstructured sources) and you have clear use cases to operationalize insights.
IBM Watson lends you AI assistance for data analysis work so you discover insightful answers sooner with less manual effort. Watson uses natural language, allowing you to type a question like “Which products grew fastest last quarter?” and receive charts, trends, and key drivers instead of raw tables. The engine builds on SPSS-level stats in the background, providing serious analytical depth without requiring long formulas. For instance, by uploading three years of sales data, you can inquire about which region has the highest churn risk, and Watson highlights patterns, outliers, and probable causes with its built-in models, making it a powerful analytics tool.
To accelerate your day, Watson automates predictive analytics and data visuals, functioning as an effective data analysis tool. You can run forecasts, segment users, or spot anomalies with a few guided steps. It selects chart types, analyzes statistical connections, and points out key insights. Imagine a marketing team dropping in campaign data and letting Watson auto-construct dashboards illustrating click-through motivators, conversion probabilities, and return projections six months into the future. While you still examine and polish the results, you avoid much of the data prep and hit-and-miss plotting that often comes with traditional data analysis techniques.
For everyday work, Watson integrates seamlessly into familiar data and cloud environments. You can connect it to various data sources, including data stores, spreadsheets, or cloud warehouses, allowing you to pull live or scheduled data instead of exporting files all day. Most teams hook Watson into their current data stack and then push insights back into planning tools, CRM, or BI dashboards. For example, a product team can feed user logs into Watson, analyze churn and adoption models, and then push those scores into a customer platform to guide outreach efforts effectively.
Watson aims to empower laypeople with access to real analytics. Initially launched in 2015, the software now comes complete with a broad range of tools for model creation, deployment, and management. You can build custom models for your datasets, explore them using natural language, and deploy machine learning models for live predictions or automated decisions. A risk team can construct a credit score model, validate it on historical data, and launch it so every new case receives a risk score instantly, showcasing its capabilities as a leading data analytics platform.
Beyond traditional tables, Watson tackles unstructured information such as text, audio, and video. This is particularly important if you deal with call center logs, survey remarks, social posts, or support tickets. Watson’s natural language and media analysis can extract themes, sentiment, or key phrases from thousands of documents. Data scientists and business analysts collaborate in one environment to create, educate, and deploy models, integrating the results into strategies and day-to-day decision-making across teams, ultimately enhancing their data analysis skills.
10. Microsoft Azure Machine Learning
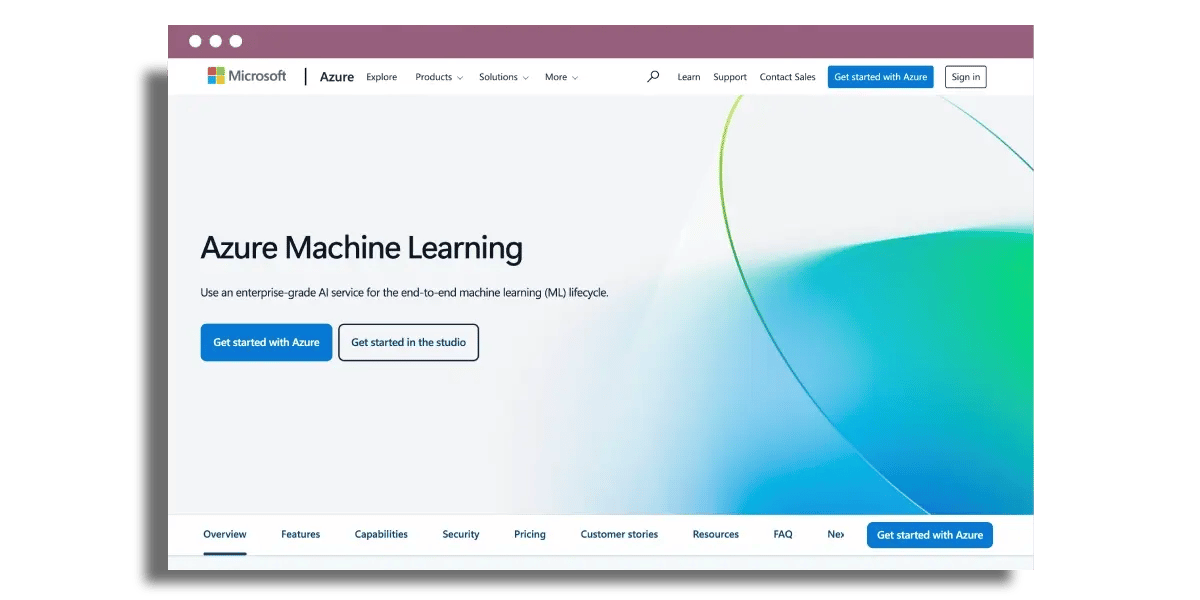
Summary: A cloud platform for training, deploying, and monitoring machine learning models with strong integration across the Azure data ecosystem.
Best for
- Teams building production ML (forecasting, scoring, optimization) on Azure
- Organisations needing MLOps, governance, and scalable deployment
What it does
- Train models with common frameworks (scikit-learn, PyTorch, TensorFlow)
- Run automated ML to establish strong baselines quickly
- Deploy models via managed endpoints (real-time or batch)
- Monitor performance, drift, and manage model/version lifecycle
Strengths
- End-to-end ML lifecycle tooling (build → deploy → monitor)
- Good for collaboration, experiment tracking, and governance
- Strong Azure integration for data pipelines and security
Limitations
- Can be complex for beginners; cloud costs require management
- Best results require MLOps discipline and strong data pipelines
Pricing snapshot
- Free plan: No (pay-as-you-go Azure usage)
- Paid costs: Compute, storage, and services billed by usage
Use case: Best when you’re moving beyond analysis into production ML—deploying models that score leads, forecast demand, or automate decisions at scale.
Azure ML provides you a complete cloud environment to develop, deploy, and monitor models at scale. You work in one place for data preparation, model training, and model running, which eliminates a lot of the tool hopping and manual glue work. For instance, you can extract raw data from cloud storage, tidy it up in a notebook, train a model, and then deploy it to a live endpoint, all within the same platform, making it one of the top data analytics tools available today.
To build models, you receive support for leading frameworks such as TensorFlow, PyTorch, and scikit-learn, allowing you to continue working with familiar data analysis tools. If your team blends backgrounds, one individual may work with scikit-learn in Python, whereas another experiments with a PyTorch-based deep learning model on GPUs. Azure ML supports both, either with single machine runs or full distributed training over many nodes when your data grows into hundreds of gigabytes.
To go fast, automated ML and pre-built algorithms help you get from raw data to a good baseline model with minimal trial and error. You can feed in a dataset, define your target column, and let AutoML run dozens of model types and hyperparameters. That’s great for use cases like demand forecasts, churn risk, or lead scoring, where you need a decent starting point before a data analyst perfects the final model.
Teamwork stays organized with the built-in collaborative space. Track experiments, keep code in GitHub or Azure DevOps, and edit in tools like Visual Studio Code while still connected to your Azure ML workspace. Version control of both code and models means you know who changed what setting, and you can roll back to an older run when a new model underperforms in production, enhancing the effectiveness of your data analysis process.
Integration with other Azure data tools enables you to create end-to-end flows. Azure Data Factory can migrate and scrub data from numerous origins, then transfer it to Azure Synapse Analytics for large-scale data processing. From there, Azure ML takes over curated data for training. The final model goes out via real-time managed endpoints or batch endpoints, allowing you to implement powerful analytics solutions seamlessly.
Monitoring and audit tools enable you to monitor model performance, data drift, and user activity. Its model catalog has hundreds of pre-trained models from many providers, so you can plug in things like language or vision models without building from scratch, making it a customizable data analytics tool for various applications.
Conclusion
You now see every tool had a distinct function. Tableau and Power BI assist you in constructing incisive reports. Google Analytics follows their path on your site. Qlik Sense, SAS, Looker and Domo provide you with robust possibilities for more intensive efforts. Spark, Watson and Azure ML bring you closer to data science and AI.
The next thing you do is going to depend on your stack, budget, and team skill. A little shop might begin with Power BI or Google Analytics. A bigger group might try Spark or Azure ML on a single obvious use case.
You don’t need a perfect plan. You only require one authentic problem, one tool, and one mini-experiment. Choose that match and begin playing with your data today!
Frequently asked questions
What are the best data analytics tools for beginners?
If you’re just starting out, begin with popular data analysis tools like Tableau, Microsoft Power BI, and Google Analytics. These powerful analytics tools feature user-friendly interfaces, robust learning communities, and a ton of free tutorials, helping you build dashboards and understand data without the need for advanced coding skills.
How do I choose the right data analytics tool for my business?
Start with your goal: reporting, dashboards, web analytics, or machine learning. Then consider integrations with your existing systems, budget, user expertise, and security requirements. Compare top data analytics tools like Tableau, Microsoft Power BI, Looker, and Domo in terms of ease of use and scalability.
Do I need coding skills to use these data analytics tools?
You don’t require code for popular data analysis tools like Tableau, Microsoft Power BI, Google Analytics, and Qlik Sense, as they provide drag-and-drop dashboards. However, for more sophisticated data analytics software such as Apache Spark or Azure Machine Learning, a coding background in Python or SQL affords you greater control.
Which tools are best for real-time and big data analytics?
For large and rapid data, Apache Spark and Microsoft Azure Machine Learning are solid options. They tackle big data and sophisticated models, while popular data analysis tools like Domo and Qlik Sense provide near real-time dashboards for business users requiring up-to-the-minute insights.
What is the difference between Tableau and Power BI?
Tableau is excellent for sophisticated data visualization and intricate dashboards, while Microsoft Power BI, a powerful analytics tool, integrates deeply with Microsoft products and is typically more affordable for Microsoft 365 users. Both are among the top data analytics tools, providing strong reporting.
Can I use these tools for predictive analytics and AI?
Yes. SAS Analytics, IBM Watson Analytics, and Microsoft Azure Machine Learning are more focused on predictive analytics and AI. They allow you to construct models, score information, and identify trends. Popular data analysis tools like Tableau and Microsoft Power BI can connect to these models for easy visualization and decision making.
Are cloud-based data analytics tools secure for my data?
Top tools such as Looker, Domo, Azure Machine Learning, and IBM Watson Analytics are among the popular data analysis tools that adhere to rigorous security standards. They support encryption, role-based access, and compliance options, making them effective data analysis tools for data teams.

The complete A-B testing software solutions guide
Read about top a/b testing software solutions to improve conversions, optimize user experiences, and drive data-driven decisions.

Best SEO tools for small businesses (that actually drive revenue in 2026)
Best SEO tools for your small businesses in 2026 that drive real revenue, tailored for your unique growth needs.

CRM vs marketing automation - what’s the difference? (and which do you need?)
CRM vs marketing automation: what’s the difference, and which one does your business actually need? Learn how they compare and when to use each.